- Google Cloud
- Cloud Forums
- Apigee
- Use Apigee Analytics Custom Report to identify att...
- Subscribe to RSS Feed
- Mark Topic as New
- Mark Topic as Read
- Float this Topic for Current User
- Bookmark
- Subscribe
- Mute
- Printer Friendly Page
- Mark as New
- Bookmark
- Subscribe
- Mute
- Subscribe to RSS Feed
- Permalink
- Report Inappropriate Content
- Mark as New
- Bookmark
- Subscribe
- Mute
- Subscribe to RSS Feed
- Permalink
- Report Inappropriate Content
The following custom report setting can help you identify potential exploit attempts that align with the CVE-2021-44228 and CVE-2021-45046 vulnerabilities. The report can show patterns in your analytics records that indicate exploit attempts. In addition, you will be able to slice and dice data with additional dimensions and metrics. If the report’s output is not empty, it may indicate that someone is attempting to exploit the vulnerability through your APIs , and you should consider further steps to protect your environment, which are explained here.
Note: For more information about Apigee's Incident report, please refer this link
- Login to Apigee UI. Go to Analyze -> Custom Reports.
- Create a new report:
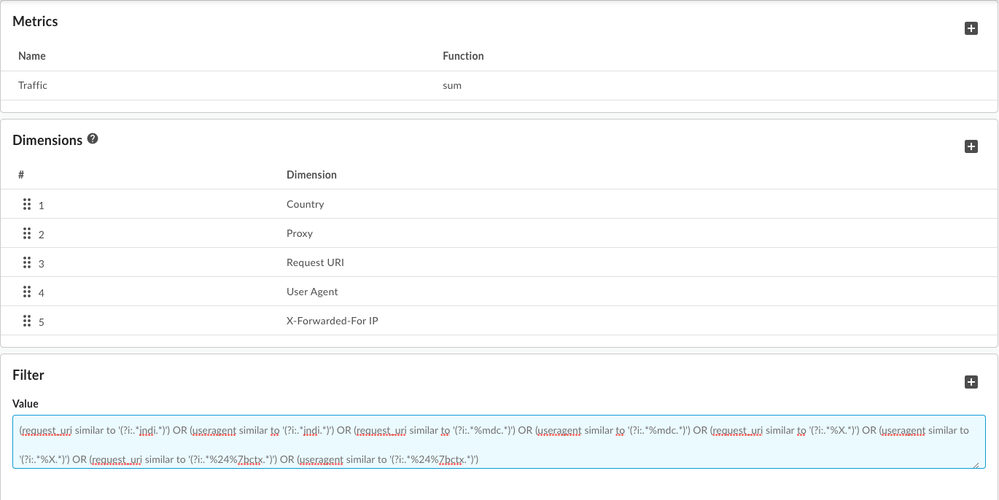
- Pick "Traffic" with "sum" as Aggregate function in the Metrics section.
- Pick "Country" / "Proxy" / "Request URI" / "User Agent" / "X-Forwarded-For IP" in the list of dimensions. (You can play around with these dimensions and also add custom dimensions if you've defined them.)
- As part of filters, add the following that identifies the malicious attempts:
(request_uri similar to '(?i:.*jndi.*)') OR (useragent similar to '(?i:.*jndi.*)') OR (request_uri similar to '(?i:.*%mdc.*)') OR (useragent similar to '(?i:.*%mdc.*)') OR (request_uri similar to '(?i:.*%X.*)') OR (useragent similar to '(?i:.*%X.*)') OR (request_uri similar to '(?i:.*%24%7bctx.*)') OR (useragent similar to '(?i:.*%24%7bctx.*)')
- Save the report.
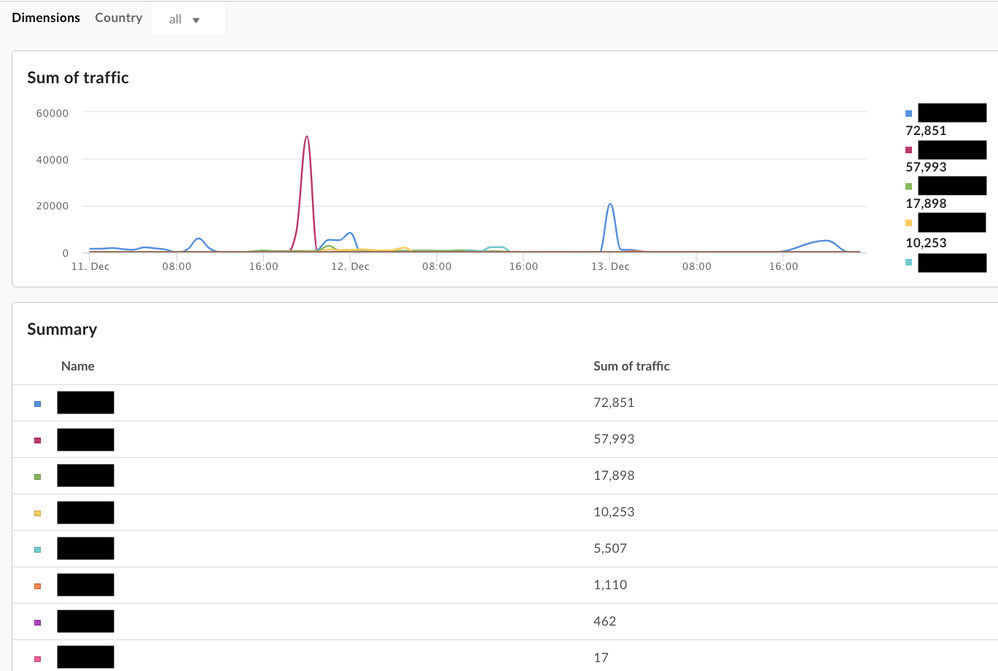
- Run the report between Dec 10 and today (e.g.: Dec 15) by using the date picker.
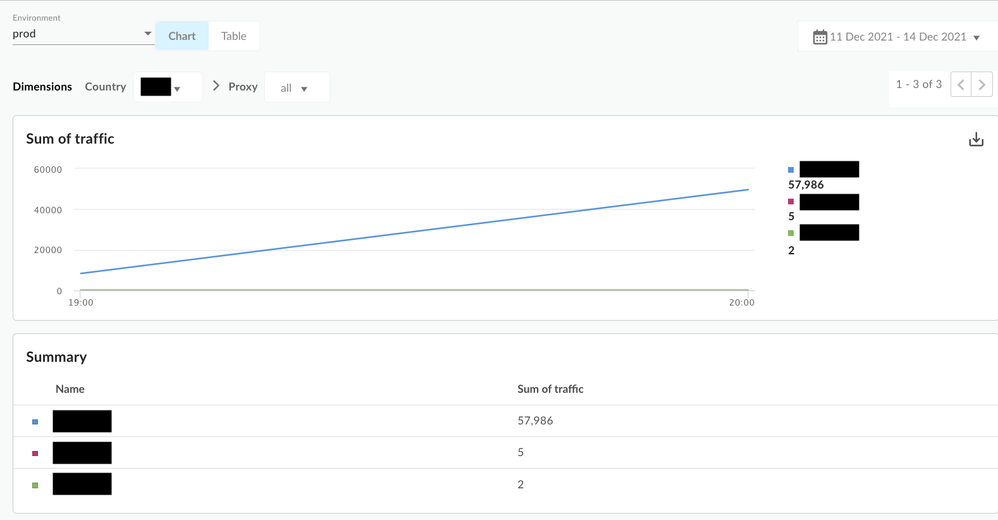
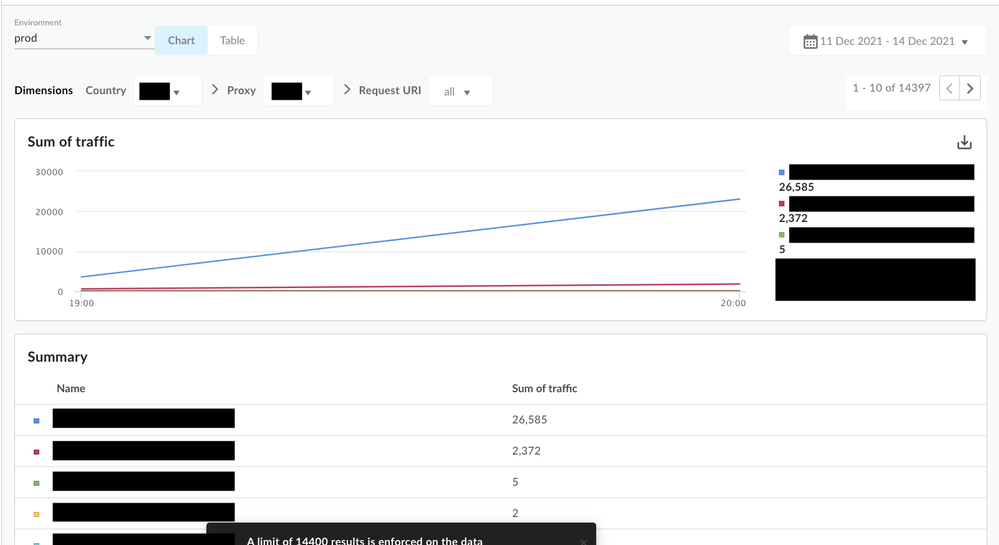
- You should be able to drill down one dimension at a time. - For example, if you see "US" as a country in the initial list, you can choose "US" in the dropdown and it will show you the "Proxy" breakdown (next dimension) and so on for the next dimension value .
Note: The drilldown is based on the order of dimensions and you can change it by editing the custom report definition to get a better understanding of the data. Running the report displays the following screenshots, which will help you get more insights into your data. Below are screenshots to help you get more insights into your data:
On running the report, you should see something similar to the following screens:
Output
Drilldown -> Country -> Proxy
Drilldown -> Country -> Proxy -> Request URI
- Labels:
-
Analytics
-
API Runtime
- Mark as New
- Bookmark
- Subscribe
- Mute
- Subscribe to RSS Feed
- Permalink
- Report Inappropriate Content
- Mark as New
- Bookmark
- Subscribe
- Mute
- Subscribe to RSS Feed
- Permalink
- Report Inappropriate Content
When trying to use the filter specified in step 3:
(request_uri similar to '(?i:.*jndi.*)') OR (useragent similar to '(?i:.*jndi.*)') OR (request_uri similar to '(?i:.*%mdc.*)') OR (useragent similar to '(?i:.*%mdc.*)') OR (request_uri similar to '(?i:.*%X.*)') OR (useragent similar to '(?i:.*%X.*)') OR (request_uri similar to '(?i:.*%24%7bctx.*)') OR (useragent similar to '(?i:.*%24%7bctx.*)').
We are seeing a Data Access Error, checking the server logs it looks to be an issue with invalid regular expression.
Noticed in the first screenshot posted that the filter at the bottom is not the same format for the regular expression posted earlier in Step 3. Could you please share the entire regular expression used in the filter?
- Mark as New
- Bookmark
- Subscribe
- Mute
- Subscribe to RSS Feed
- Permalink
- Report Inappropriate Content
- Mark as New
- Bookmark
- Subscribe
- Mute
- Subscribe to RSS Feed
- Permalink
- Report Inappropriate Content
Hi amumtaz-fm!
Thanks for catching the issue in the screenshot! The latest filter is the one in the text and the screenshot needs update.
Could you please share the screenshots with the Data Access Error and your filter settings page (either in this thread or open a support ticket)?
- Mark as New
- Bookmark
- Subscribe
- Mute
- Subscribe to RSS Feed
- Permalink
- Report Inappropriate Content
- Mark as New
- Bookmark
- Subscribe
- Mute
- Subscribe to RSS Feed
- Permalink
- Report Inappropriate Content
When using the query provided in the steps above we are getting the Data Access Error however if we change the syntax from 'similar to' to 'like'. We are no longer getting the error. For example:
(request_uri like '(?i:.*jndi.*)') or (useragent like '(?i:.*jndi.*)') or (request_uri like '(?i:.*%mdc.*)') or (useragent like '(?i:.*%mdc.*)') or (request_uri like '(?i:.*%X.*)') or (useragent like '(?i:.*%X.*)') or (request_uri like '(?i:.*%24%7bctx.*)') or (useragent like '(?i:.*%24%7bctx.*)')
Will using 'like' work? We are not seeing any data so not sure if its an issue with the filter or no traffic meeting the criteria.
- Mark as New
- Bookmark
- Subscribe
- Mute
- Subscribe to RSS Feed
- Permalink
- Report Inappropriate Content
- Mark as New
- Bookmark
- Subscribe
- Mute
- Subscribe to RSS Feed
- Permalink
- Report Inappropriate Content
Unfortunately there are differences between the analytics datastore for Edge Cloud (Google BigQuery) and Edge Private Cloud (postgresql) that don't translate directly across. While Postgres does have a SIMILAR TO operator, the management server's query parser that processes the Reports query sent by edge-ui, is not setup to accept this.
Unfortunately using the 'LIKE' operator as a drop-in replacement for 'SIMILAR TO' will not work as might be desired. LIKE will not pattern match the POSIX type regular expressions as in the example.
The easiest workaround is to login directly to the postgres database following the Step 3 in Public Documentation:
psql -h /opt/apigee/var/run/apigee-postgresql -U apigee apigee
And execute the following (or similar, selecting for fields of interest to your team) query (as a starting point):
SELECT
  client_received_start_timestamp,
  apiproxy,
  request_uri,
  useragent,
  x_forwarded_for_ip
FROM
  analytics."org.env.fact"
WHERE
  (LOWER(request_uri) ~ '(?:.*jndi.*)')
  OR (LOWER(useragent) ~ '(?:.*jndi.*)')
  OR (LOWER(request_uri) ~ '(?:.*%mdc.*)')
  OR (LOWER(useragent) ~ '(?:.*%mdc.*)')
  OR (LOWER(request_uri) ~ '(?:.*%X.*)')
  OR (LOWER(useragent) ~ '(?:.*%X.*)')
  OR (LOWER(request_uri) ~ '(?:.*%24%7bctx.*)')
  OR (LOWER(useragent) ~ '(?:.*%24%7bctx.*)')
  AND client_received_start_timestamp >= '2021-12-21 00:00:00.000'
  AND client_received_start_timestamp < '2021-12-21 00:01:00.000'
ORDER BY
  client_received_start_timestamp DESC
LIMIT
  10;
Note that in the above query, you would need to replace the string "org.env.fact" with your actual Apigee private cloud organization and environment, e.g. for organization equal to "myorg" and environment equal to "prod", the corresponding fact table would be analytics."myorg.prod.fact".
The above query is deliberately time bound to one hour and limited to only 10 records, in order to protect against querying too large a dataset. Once your team has clarified that the query matches on the expressions of concern and contains the fields of interest to your team, your team can adjust the query as needed to focus on time ranges, proxies, etc of specific interest.
- Mark as New
- Bookmark
- Subscribe
- Mute
- Subscribe to RSS Feed
- Permalink
- Report Inappropriate Content
- Mark as New
- Bookmark
- Subscribe
- Mute
- Subscribe to RSS Feed
- Permalink
- Report Inappropriate Content
We updated the first screenshot to reflect the filter query. Thank you very much.
Regarding updating the filter query from 'similar to' to 'like' to avoid the Data Access Error, yet the new query is not showing any data could mean there is no traffic meeting the criteria. Try issuing runtime API calls with uri or useragent containing the keywords to confirm if the filter works in your setup. If the filter continues to not show any matching data and you believe it should, please submit a support incident for us to further investigate the cause. Thank you.
- Mark as New
- Bookmark
- Subscribe
- Mute
- Subscribe to RSS Feed
- Permalink
- Report Inappropriate Content
- Mark as New
- Bookmark
- Subscribe
- Mute
- Subscribe to RSS Feed
- Permalink
- Report Inappropriate Content
@kyfu Please let us know, once we load with above custom report data using listed filter for Apigee OPDK
(request_uri like '(?i:.*jndi.*)') or (useragent like '(?i:.*jndi.*)') or (request_uri like '(?i:.*%mdc.*)') or (useragent like '(?i:.*%mdc.*)') or (request_uri like '(?i:.*%X.*)') or (useragent like '(?i:.*%X.*)') or (request_uri like '(?i:.*%24%7bctx.*)') or (useragent like '(?i:.*%24%7bctx.*)')
How to identify or conclude on attempts of Log4j 2 exploit using above graph ? was able to load above until "Drilldown -> Country -> Proxy -> Request URI"
-
Analytics
497 -
API Hub
75 -
API Runtime
11,664 -
API Security
175 -
Apigee General
3,029 -
Apigee X
1,273 -
Developer Portal
1,907 -
Drupal Portal
43 -
Hybrid
461 -
Integrated Developer Portal
87 -
Integration
309 -
PAYG
13 -
Private Cloud Deployment
1,068 -
User Interface
75
| User | Count |
|---|---|
| 2 | |
| 1 | |
| 1 | |
| 1 | |
| 1 |

 Twitter


