- Google Cloud
- Articles & Information
- Cloud Product Articles
- Apigee Hybrid Infrastructure Monitoring Metrics
- Subscribe to RSS Feed
- Mark as New
- Mark as Read
- Bookmark
- Subscribe
- Printer Friendly Page
- Report Inappropriate Content
- Article History
- Subscribe to RSS Feed
- Mark as New
- Mark as Read
- Bookmark
- Subscribe
- Printer Friendly Page
- Report Inappropriate Content
Apigee is a platform for developing and managing API proxies that features a hybrid deployment model. The hybrid model includes a management plane hosted by Apigee in Google Cloud and a runtime plane that you install and manage on supported Kubernetes platforms.
As part of managing the runtime plane, monitoring is an important aspect to ensure the runtime is operating as expected. For this we can leverage Cloud Monitoring, and here are some guidelines to help you get started with this topic from an infrastructure point of view.
Metrics
Several metrics of the Apigee hybrid runtime can be monitored. They can generally be separated into the following groups: Pod monitoring and Node monitoring
Node monitoring metrics:
Node metrics give an insight into the status and condition of the nodes and can be used to monitor the resource utilization. Some useful metrics to measure node resource utilization, including:
- CPU utilization: The fraction of allocatable CPU currently in use on the instance, as well as request and limit utilization.
- Memory utilization: The fraction of the allocatable memory that is currently in use on the instance.
- Storage: Local ephemeral storage bytes used by the node.
- Network bytes received/transmitted by the node.
Pod monitoring metrics:
Metrics for monitoring pods can be separated into three categories:
- Kubernetes metrics
- Pod count: Actual/desired number of pods
- Pod volume utilization: The fraction of the volume that is currently being used by the instance
- Pod request latency
- Container metrics
- CPU utilization: The fraction of CPU request and limit utilization
- Memory limit utilization: The fraction of the memory limit that is currently in use on the instance
- Restart count: Number of times the container has restarted
- Application metrics
- Apigee hybrid generates many metrics that can be used to monitor the runtime components.
Monitoring
Metrics generated and collected by the hybrid runtime are sent to Cloud Monitoring, where you can visualize them and monitor the health of the system.
Use Monitoring Dashboards, Alerts and Notifications to:
- View and analyze metric data using predefined dashboards for the resources and services that you use.
- Create custom dashboards to analyze Apigee hybrid metrics by creating charts for these metrics.
- Create alerts using policies with hybrid runtime metrics based on threshold conditions.
- Create notifications based on alerts to take action when they are triggered.
- Create Service Level Objectives(SLO) charts.
Basic Metrics for Apigee hybrid Infrastructure Monitoring:
|
Metrics Resource Type |
Example Relevant Containers |
Metrics |
Metrics Description |
|
k8s_container |
Istio-ingressgateway Apigee-runtime Apigee-cassandra Apigee-redis apigee-redis-envoy |
kubernetes.io/container/cpu/request_utilization |
The fraction of the requested CPU that is currently in use on the instance. This value can be greater than 1 as usage can exceed the request Note: The Apigee overrides for the runtime component has a default cpu request of 500m |
|
k8s_container |
Apigee-redis Apigee-redis-envoy Apigee-runtime Istio-ingressgateway |
kubernetes.io/container/memory/limit_utilization |
The fraction of the memory limit that is currently in use on the instance. This value cannot exceed 1 as usage cannot exceed the limit. |
|
k8s_container |
kubernetes.io/container/restart_count |
Number of times the container has restarted. |
|
|
k8s_pod |
Istio-ingressgateway Apigee-runtime |
kubernetes.io/pod/network/received_bytes_count |
Cumulative number of bytes received by the pod over the network. |
|
k8s_pod |
Istio-ingressgateway Apigee-runtime |
kubernetes.io/pod/network/sent_bytes_count |
Cumulative number of bytes transmitted by the pod over the network. |
|
k8s_pod |
istio.io/service/client/request_count |
Number of requests handled by an Istio proxy (Ingress gateway) |
|
|
k8s_pod |
istio.io/service/client/roundtrip_latencies |
Distribution of outgoing requests round trip latency from the service. |
|
|
k8s_node |
node/memory/allocatable_utilization |
The fraction of the allocatable memory that is currently in use on the instance. This value cannot exceed 1 as usage cannot exceed allocatable memory bytes. |
|
|
k8s_node |
node/cpu/allocatable_utilization |
The fraction of the allocatable CPU that is currently in use on the instance. |

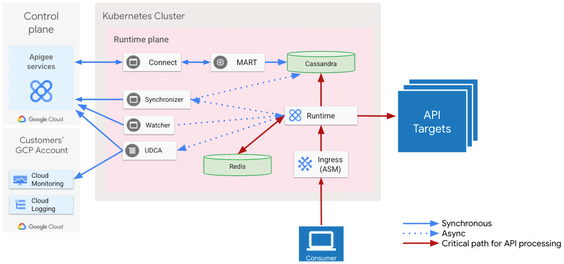
Apigee hybrid runtime architecture
Note the above components on the critical path for API processing - components on this path in an unhealthy state will impact the processing of API requests.
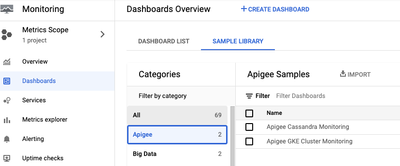
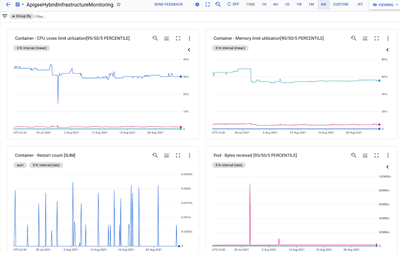
A preconfigured sample Apigee Cluster dashboard is also available within the Google Cloud Console's Cloud Monitoring Sample dashboards.

Cloud Monitoring Apigee Sample Dashboards

Apigee Cluster Monitoring Sample Dashboard
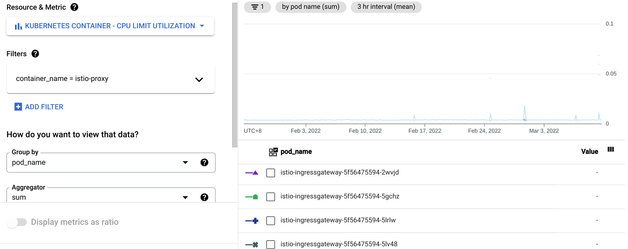
Sample Metrics configuration with “Filters” and “Group by” Options:

Further resources
If you're also interested in Apigee API Proxy based monitoring, this documentation covers Alerting and Monitoring configuration approach based on Apigee API Proxy metrics.
For Cassandra, this article covers suggestions specific to Cassandra monitoring and alerting.
Complete list of Kubernetes metrics and definitions can be found at https://cloud.google.com/monitoring/api/metrics_kubernetes
Thanks to Abirami Balasubramanian, Kamaljit Singh, Andy Trickett and Omid Tahouri for input, collaboration and review.
- Mark as Read
- Mark as New
- Bookmark
- Permalink
- Report Inappropriate Content
hi, Please clarify -
"Several metrics of the Apigee hybrid runtime can be monitored" - are these metrics available to passed over to 3rd party tools (new relic, data dog etc.) or these 3rd party tools need to be setup with their own configurations from scratch to be populated with these kind of metrics. How will these tools be configured to capture apigee specific metrics such as proxyv2request_count, UDCA specific etc. Please share some thoughts. thx

 Twitter