This website uses Cookies. Click Accept to agree to our website's cookie use as described in our Privacy Policy. Click Preferences to customize your cookie settings.
Turn on suggestions
Auto-suggest helps you quickly narrow down your search results by suggesting possible matches as you type.
Showing results for
- Google Cloud
- Articles & Information
- Cloud Product Articles
- Use Custom Dashboards in Cloud Monitoring to Visua...
Topic Options
- Subscribe to RSS Feed
- Mark as New
- Mark as Read
- Bookmark
- Subscribe
- Printer Friendly Page
- Report Inappropriate Content
shellyhersh
Staff
Topic Options
- Article History
- Subscribe to RSS Feed
- Mark as New
- Mark as Read
- Bookmark
- Subscribe
- Printer Friendly Page
- Report Inappropriate Content
1
0
703
This guide will walk you through creating a custom dashboard in Cloud Monitoring to visualize Apigee Target latencies with a 99th percentile aggregation by environment.
Steps
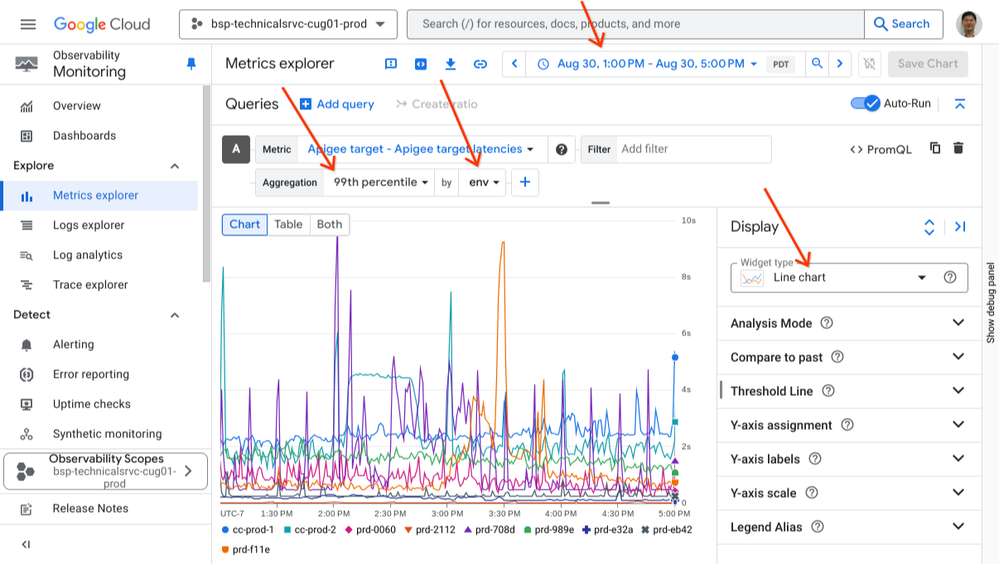
1. Navigate to Metrics Explorer:
- Go to the Google Cloud Console.
- Select Monitoring from the navigation menu.
- Click on Metrics Explorer.
2. Select the Metric:
- In the Find resource type and metric field, start typing "Apigee Target".
- Select Apigee Target > Target > Apigee target latencies from the dropdown list.
3. Specify the Time Period:
- Click on the Time range dropdown menu at the top of the page.
- Choose a predefined time period (e.g., last hour, last 6 hours) or select a custom time range.
4. Aggregate by Environment:
- In the Group by field, select env. This will group the latencies by environment, allowing you to compare performance across different environments.
5. Apply 99th Percentile Aggregation:
- Click on the Aggregator dropdown menu.
- Select 99th percentile. This will show you the 99th percentile latency, which is a good indicator of the worst-case performance.
6. Change the Display to Line Chart:
- Click on the Chart type dropdown menu.
- Select Line chart. This will display the latencies as a line chart, making it easy to see trends over time.
- If you like to see the latency per endpoint, it can be achieved by choosing endpoint:
7. Save to a Custom Dashboard:
- Click the Save chart button in the top right corner of the chart.
- Select Add to dashboard, then choose Create new.
- Give your dashboard a name and click Save.
You have now created a custom dashboard that displays the 99th percentile latency of your Apigee targets, grouped by environment!
Tips:
- You can further customize your dashboard by adding more charts, changing the layout, and adding filters.
- Explore other Apigee Target metrics in the Metrics Explorer to gain deeper insights into your API performance.
- Set up alerting policies based on your custom dashboards to get notified of performance issues.
By following these steps, you can effectively monitor your Apigee Target latencies and ensure optimal performance for your APIs.
Sample Dashboards:
P99 Target Latency for the endpoint "digitalcoupon-prd.ncrcloud.com":
Topic Labels

 Twitter


