- Google Cloud
- Cloud Forums
- Data Analytics
- Dataproc Alert policy
- Subscribe to RSS Feed
- Mark Topic as New
- Mark Topic as Read
- Float this Topic for Current User
- Bookmark
- Subscribe
- Mute
- Printer Friendly Page
- Mark as New
- Bookmark
- Subscribe
- Mute
- Subscribe to RSS Feed
- Permalink
- Report Inappropriate Content
- Mark as New
- Bookmark
- Subscribe
- Mute
- Subscribe to RSS Feed
- Permalink
- Report Inappropriate Content
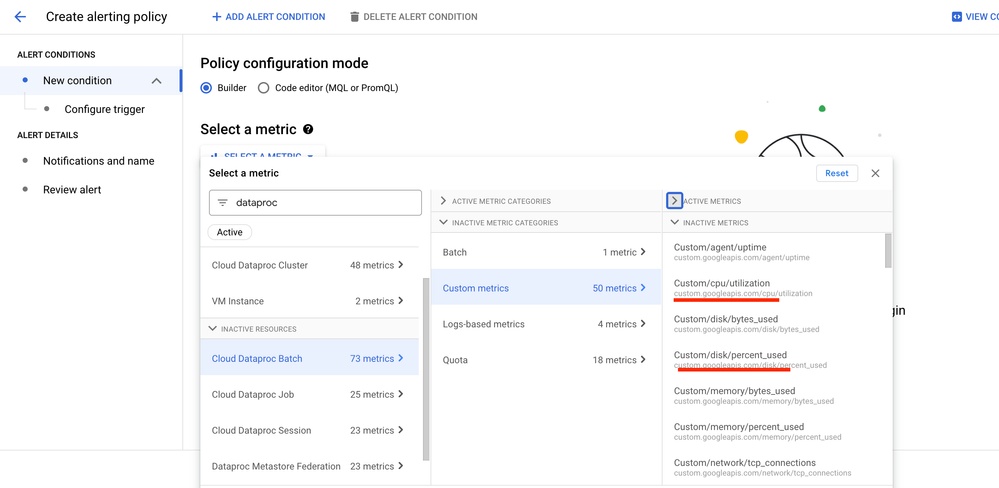
- custom/cpu/utilization
- custom/disk/percent_used
how are the above cloud dataproc batch metric useful when setting up the alerting policy?
Solved! Go to Solution.
- Mark as New
- Bookmark
- Subscribe
- Mute
- Subscribe to RSS Feed
- Permalink
- Report Inappropriate Content
- Mark as New
- Bookmark
- Subscribe
- Mute
- Subscribe to RSS Feed
- Permalink
- Report Inappropriate Content
The custom/cpu/utilization and custom/disk/percent_used metrics are essential for effective alerting policies in Cloud Monitoring, targeting Dataproc batch jobs. These metrics offer critical insights into the health and performance of your clusters, empowering proactive issue resolution and resource optimization.
CPU Utilization (custom/cpu/utilization) :
- Performance Indicator: Elevated CPU usage may indicate that your job is under-resourced, running slower than expected.
- Scaling Decisions: Utilize CPU utilization alerts to justify scaling actions, accommodating increased demand.
- Troubleshooting: Sudden spikes could suggest inefficient code or resource conflicts, necessitating code audits or configuration reviews.
Disk Usage (custom/disk/percent_used) :
- Job Failure Prevention: Adequate disk space is pivotal; nearing capacity can cause job disruptions. Early alerts facilitate timely expansions or cleanup.
- Resource Planning: Continual monitoring aids in predicting storage requirements, preventing capacity surprises.
Setting Up Alerts:
- Select a Metric: Navigate to "ALERT CONDITIONS" in Cloud Monitoring and click "Select a metric."
- Expand Cloud Dataproc Batch: Access specific metrics for detailed monitoring.
- Choose Metric: Opt for
custom/cpu/utilizationorcustom/disk/percent_used. - Configure Trigger: Establish alerts based on your operational benchmarks—consider threshold levels, notification frequency, and alert severity.
Going Beyond the Basics: While CPU and disk metrics are fundamental, integrating additional metrics—such as Memory Usage, Network I/O, and Job Completion Time—enhances your monitoring framework. These metrics help track potential memory issues, identify network bottlenecks, and monitor job efficiency.
Proactive Monitoring: Beyond reactive alerts, regularly review metrics and logs to discern trends or imminent concerns. This holistic approach to monitoring ensures your Dataproc batch jobs are not only running smoothly but also optimized for performance and cost.
By strategically monitoring these metrics and setting up customized alerts, you ensure that your Dataproc batch jobs operate efficiently, with ideal resource utilization, thereby enhancing overall productivity and system health.
- Mark as New
- Bookmark
- Subscribe
- Mute
- Subscribe to RSS Feed
- Permalink
- Report Inappropriate Content
- Mark as New
- Bookmark
- Subscribe
- Mute
- Subscribe to RSS Feed
- Permalink
- Report Inappropriate Content
The custom/cpu/utilization and custom/disk/percent_used metrics are essential for effective alerting policies in Cloud Monitoring, targeting Dataproc batch jobs. These metrics offer critical insights into the health and performance of your clusters, empowering proactive issue resolution and resource optimization.
CPU Utilization (custom/cpu/utilization) :
- Performance Indicator: Elevated CPU usage may indicate that your job is under-resourced, running slower than expected.
- Scaling Decisions: Utilize CPU utilization alerts to justify scaling actions, accommodating increased demand.
- Troubleshooting: Sudden spikes could suggest inefficient code or resource conflicts, necessitating code audits or configuration reviews.
Disk Usage (custom/disk/percent_used) :
- Job Failure Prevention: Adequate disk space is pivotal; nearing capacity can cause job disruptions. Early alerts facilitate timely expansions or cleanup.
- Resource Planning: Continual monitoring aids in predicting storage requirements, preventing capacity surprises.
Setting Up Alerts:
- Select a Metric: Navigate to "ALERT CONDITIONS" in Cloud Monitoring and click "Select a metric."
- Expand Cloud Dataproc Batch: Access specific metrics for detailed monitoring.
- Choose Metric: Opt for
custom/cpu/utilizationorcustom/disk/percent_used. - Configure Trigger: Establish alerts based on your operational benchmarks—consider threshold levels, notification frequency, and alert severity.
Going Beyond the Basics: While CPU and disk metrics are fundamental, integrating additional metrics—such as Memory Usage, Network I/O, and Job Completion Time—enhances your monitoring framework. These metrics help track potential memory issues, identify network bottlenecks, and monitor job efficiency.
Proactive Monitoring: Beyond reactive alerts, regularly review metrics and logs to discern trends or imminent concerns. This holistic approach to monitoring ensures your Dataproc batch jobs are not only running smoothly but also optimized for performance and cost.
By strategically monitoring these metrics and setting up customized alerts, you ensure that your Dataproc batch jobs operate efficiently, with ideal resource utilization, thereby enhancing overall productivity and system health.
-
Analytics General
270 -
API
1 -
BAA
1 -
BigQuery
910 -
Business Intelligence
62 -
Cloud Bigtable
1 -
Cloud Composer
49 -
Cloud Data Fusion
69 -
Cloud Functions
1 -
Cloud Identity
1 -
Cloud PubSub
146 -
Cloud Storage
1 -
Data Catalog
41 -
Data Transfer
107 -
Dataflow
154 -
Dataform
174 -
Dataprep
20 -
Dataproc
86 -
Datastream
24 -
Dialogflow
1 -
GCP
1 -
Gen App Builder
1 -
github
1 -
Google Data Studio
60 -
Looker
72
- « Previous
- Next »
| User | Count |
|---|---|
| 5 | |
| 4 | |
| 2 | |
| 1 | |
| 1 |

 Twitter