- Google Cloud
- Cloud Forums
- Apigee
- Use Apigee Analytics Custom Report to identify att...
- Subscribe to RSS Feed
- Mark Topic as New
- Mark Topic as Read
- Float this Topic for Current User
- Bookmark
- Subscribe
- Mute
- Printer Friendly Page
- Mark as New
- Bookmark
- Subscribe
- Mute
- Subscribe to RSS Feed
- Permalink
- Report Inappropriate Content
- Mark as New
- Bookmark
- Subscribe
- Mute
- Subscribe to RSS Feed
- Permalink
- Report Inappropriate Content
The following custom report setting can help you identify potential exploit attempts that align with the CVE-2021-44228 and CVE-2021-45046 vulnerabilities. The report can show patterns in your analytics records that indicate exploit attempts. In addition, you will be able to slice and dice data with additional dimensions and metrics. If the report’s output is not empty, it may indicate that someone is attempting to exploit the vulnerability through your APIs , and you should consider further steps to protect your environment, which are explained here.
Note: For more information about Apigee's Incident report, please refer this link
- Login to Apigee UI. Go to Analyze -> Custom Reports.
- Create a new report:
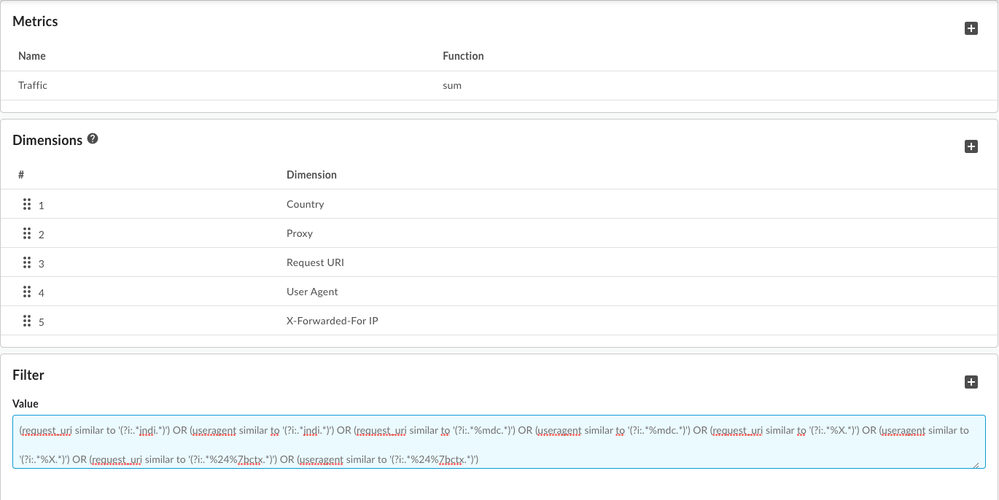
- Pick "Traffic" with "sum" as Aggregate function in the Metrics section.
- Pick "Country" / "Proxy" / "Request URI" / "User Agent" / "X-Forwarded-For IP" in the list of dimensions. (You can play around with these dimensions and also add custom dimensions if you've defined them.)
- As part of filters, add the following that identifies the malicious attempts:
(request_uri similar to '(?i:.*jndi.*)') OR (useragent similar to '(?i:.*jndi.*)') OR (request_uri similar to '(?i:.*%mdc.*)') OR (useragent similar to '(?i:.*%mdc.*)') OR (request_uri similar to '(?i:.*%X.*)') OR (useragent similar to '(?i:.*%X.*)') OR (request_uri similar to '(?i:.*%24%7bctx.*)') OR (useragent similar to '(?i:.*%24%7bctx.*)')
- Save the report.
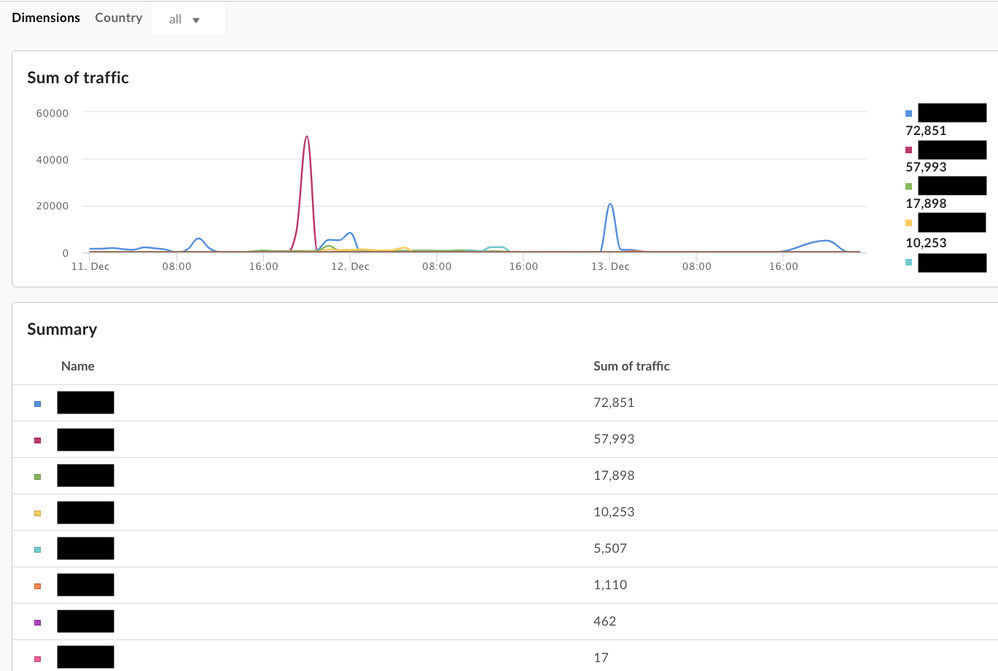
- Run the report between Dec 10 and today (e.g.: Dec 15) by using the date picker.
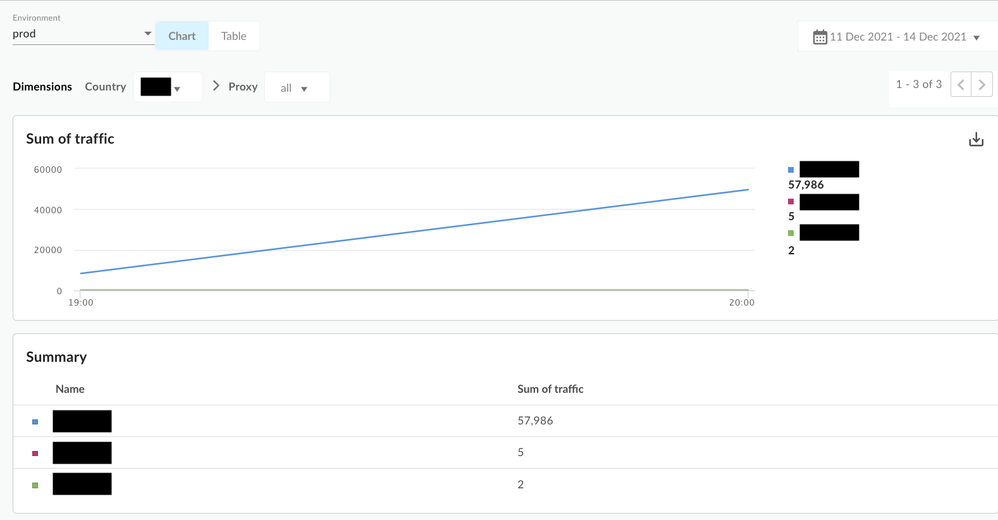
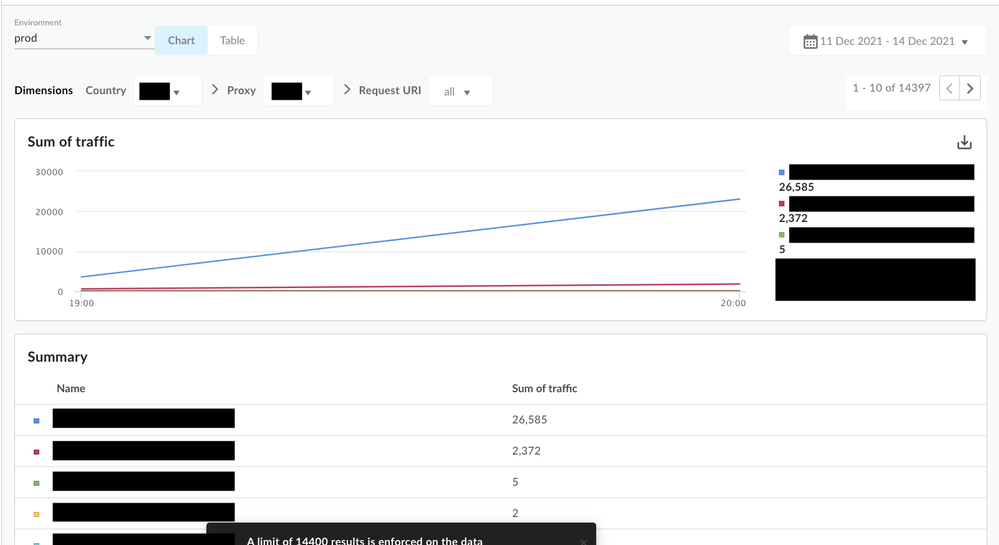
- You should be able to drill down one dimension at a time. - For example, if you see "US" as a country in the initial list, you can choose "US" in the dropdown and it will show you the "Proxy" breakdown (next dimension) and so on for the next dimension value .
Note: The drilldown is based on the order of dimensions and you can change it by editing the custom report definition to get a better understanding of the data. Running the report displays the following screenshots, which will help you get more insights into your data. Below are screenshots to help you get more insights into your data:
On running the report, you should see something similar to the following screens:
Output
Drilldown -> Country -> Proxy
Drilldown -> Country -> Proxy -> Request URI
- Labels:
-
Analytics
-
API Runtime
-
Analytics
524 -
API Gateway
58 -
API Hub
105 -
API Runtime
11,757 -
API Security
225 -
Apigee General
3,456 -
Apigee X
1,645 -
Cloud Endpoints
1 -
Developer Portal
1,957 -
Drupal Portal
56 -
Hybrid
529 -
Integrated Developer Portal
117 -
Integration
346 -
PAYG
19 -
Private Cloud Deployment
1,098 -
User Interface
91
- « Previous
- Next »

 Twitter


