- Google Cloud
- Articles & Information
- Community Blogs
- Simplify Day 2 Cloud Operations with Google Cloud ...
Simplify Day 2 Cloud Operations with Google Cloud Solutions and Architectural Design Best Practices
- Subscribe to RSS Feed
- Mark as New
- Mark as Read
- Bookmark
- Subscribe
- Printer Friendly Page
- Report Inappropriate Content
Congratulations! You've deployed your app, set up your Kubernetes cluster, or launched a new service. But now come the challenges of day 2 operations - managing configuration drift, service reliability, scaling up, and more.
In our latest Ask Me Anything session, Google Cloud experts, Omkar Suram (@omkarsuram_) and Rakesh Dhoopar, shared key principles and best practices to reduce the complexity of day 2 cloud operations, including how to use Google Cloud products and new features in the operational tools portfolio.
In this article, we cover the key takeaways from the session, along with written Q&A and supporting resources.
If you have any additional questions, please leave a comment below and someone from the Community or Google Cloud team will be happy to help.
- Session recording
- 3 key themes to optimize your day 2 cloud operations
- 1. Design resilient services
- 2. Understand your operational tools portfolio
- Google Cloud operators portfolio: Solutions and capabilities
- 3. Improve your cloud operations
- Standardize on best practices
- Build on open standards
- Improve cloud operations with Google Cloud solutions
- Google Cloud Managed Service for Prometheus
- Log Analytics
- Network Intelligence Center
- Apigee API Management
- Active Assist
- Cloud operations Q&A
Session recording
Tip 👉 Use the time stamplinks in the YouTube description to quickly get to the topics you care about most.
3 key themes to optimize your day 2 cloud operations
There are 3 key themes to optimize your day 2 operations. The following provides a quick overview of these themes, of which we dive into more detail further below.
- Design resilient services
- Ensure you standardize deployments and incorporate automation wherever possible
- Using architectural standards and deploying with automation helps you standardize your builds, tests, and deployments, which helps to eliminate human-induced errors for repeated processes like code updates and provides confidence in testing before deployment. Understand your operational tools portfolio
- Understand your operational tools portfolio
- Understand the tools available to you, especially how can you focus on improving operational excellence, rather than managing the tools themselves
- Even in the best case scenario, things don’t always go as expected and something will eventually break. Understanding what tools are available and how they can help you identify and resolve an issue will reduce the impact and return your applications to operations faster.
- Improve your cloud operations
- Applying Google Cloud operational tools will help you accomplish a variety of operations tasks, such as monitoring performance, anomaly detection, or even securing your cloud against abuse
- Google Cloud operational tooling provides insights that help you understand what is happening faster and in turn, improve the efficiency of your operations
1. Design resilient services
Based on the Google Cloud Architecture Framework - specifically the Operational Excellence and Reliability pillars - here are a few key recommendations to design resilient services:
- Automate your deployments: Store code in a central repository, version control systems with tagging, enable the ability to roll back code changes, and use CI/CD. Use IaC (like Terraform) to minimize deployment errors, and perform robust testing to validate new changes
- Launch gradually with the ability to rollback changes quickly: Choose deployment strategies like rolling updates, A/B testing, etc.
- Use Google Cloud managed services where possible to remove operational overhead and reduce toil
- Keep it simple and focus on the user: The SLIs, SLOs, alerts, and reports generated should make sense to users inside and outside the organization
- Design for scale and high availability: Design a multi-zone architecture with failover for high availability
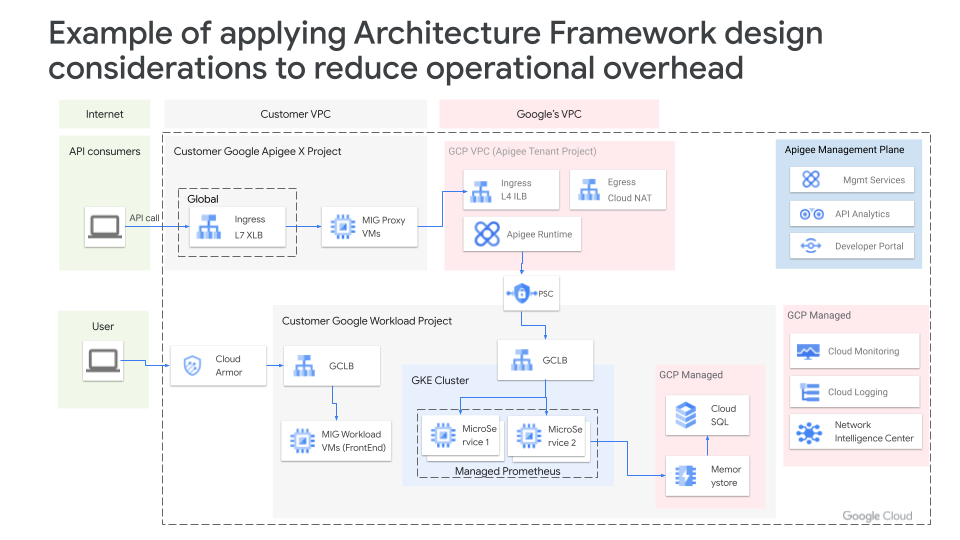
Below is an example of sample architecture that has incorporated various managed services, such as Google Cloud Armor, Cloud Load Balancing, Apigee, Managed Instance Groups, GKE Autopilot, Cloud SQL, Operations Suite, etc. Such an architecture provides better scalability and reduces burden on your operations teams.
Your architecture design will vary based on your use case or business needs, but the main point here is to showcase the value of managed services in operationalizing your workloads. Let Google help you take care of maintaining availability of these services, while you focus on improving your applications.
Remember, optimization is a continuous, ongoing exercise and a robust architecture is foundational to achieving operational excellence.
Get started building your own architecture today with the Google Cloud Architecture diagramming tool.
2. Understand your operational tools portfolio
As you embark on your operational journey, you should develop a good understanding of the complete portfolio of tools and capabilities that help you get your jobs done. With this knowledge, you can strategically plan your day-to-day tasks and leverage the most relevant capabilities to derive the most value for your work and time.
Google Cloud operators portfolio: Solutions and capabilities
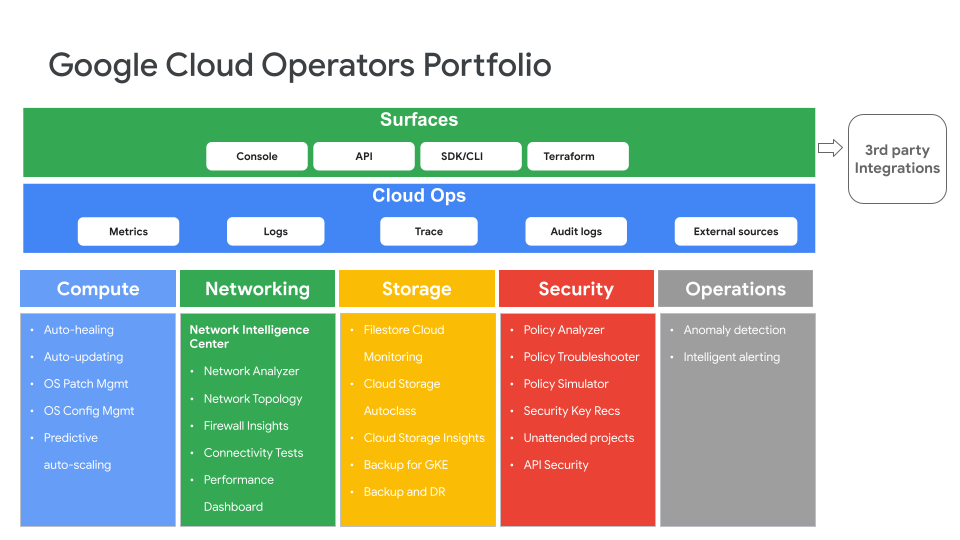
In the past, day 2 activities ranged widely and often required a multitude of tasks delivered through siloed tools. However, as cloud platforms have evolved, day 2 activities and tools (especially those considered to be in the operations space) can now be categorized into a few primary groups.
First, many day 2 operations activities that were performed manually in the past have been automated and integrated into the core cloud platform itself. These native day 2 capabilities are available as part of Google Cloud’s compute, network, storage, and security services, including auto-scaling, auto-patching, auto-healing, backups, runtime security postures, etc.
The second group of day 2 operations activities are related to aggregate observability across the entire platform, including Google Cloud services and applications that users deploy on top of these services. These activities are performed either at a fleet level, service level, or at the application level, and the observability capabilities include monitoring, logging, tracing and auditing that help customers understand the health of their Google Cloud deployment and troubleshoot problems.
Last but not least is the top layer, which provides different surfaces through which your cloud operations tools and capabilities can be accessed. This includes APIs, SDKs, the Cloud Console, and automation using Terraform.
We’ll dive deeper into a few specific tools in Google Cloud’s operations portfolio later on in this article, including Google Cloud Managed Service for Prometheus, Log Analytics, Network Intelligence Center, Apigee API Management, and Active Assist.
3. Improve your cloud operations
After you develop an understanding of your solutions portfolio, how do you leverage these tools and implement an effective cloud operations strategy? In this section, we’ll cover best practices to help your organization simplify and improve its cloud operations, as well as touch on some of the newer capabilities Google Cloud has recently announced to support these best practices.
Standardize on best practices
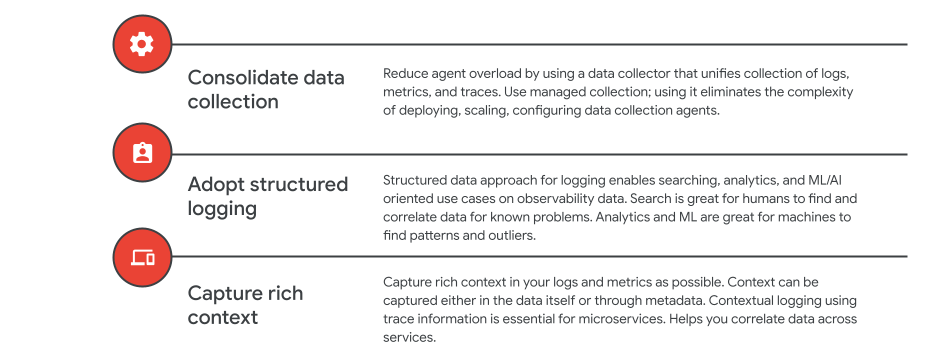
There are 3 types of observability data: metrics, logs, and traces. In many instances, customers deploy different collectors or agents for collecting these different signals, which can be challenging from both a collector administration and resource management point-of-view.
With that in mind, our first best practice is to deploy unified collectors that can help collect metrics, logs, and traces. This is certainly possible with the OTEL (OpenTelemetry) collector and the unified cloud Ops Agent offered by Google.
Traditionally logs have been unstructured or semi-structured, but increasingly, logs have become more structured. So as a second best practice, we recommend that users adopt structured logging.
With unstructured logs, the primary mode of exploration is search oriented. You can enforce some structure during your query, but that becomes quite onerous. However, if you generate structured logs to begin with, then it’s easier to apply additional techniques, including analytics, AI and ML, correlation, etc. to easily find patterns and outliers. This comes in very handy especially in complex and highly distributed application architectures.
Lastly, as applications become more complex, it becomes increasingly important to collect richer context from your signals. Whether you collect that through labels in metrics, or through fields in structured log events, this context helps you slice and dice the data, quickly analyze and make correlations.
Furthermore, to help make troubleshooting easier, consider capturing a unique identifier - such as a Trace ID - that spans a user request across all services.
Build on open standards
The second group of best practices are related to building your observability footprint based on open standards.
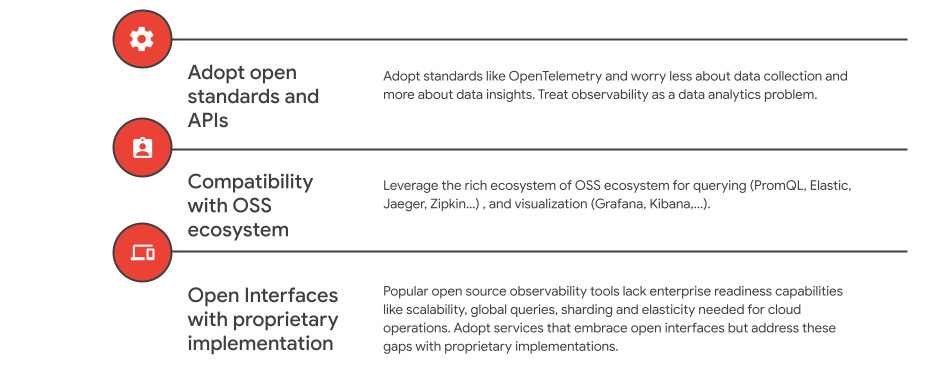
Over the past two decades, one of the big challenges for operators was how to keep up with collecting metrics and logs data. There were many proprietary solutions and all of them were siloed and incomplete. Users spent more time figuring out how to ingest data rather than how to derive actionable insights and get their jobs done. Adopting open APIs and standards like OTEL can reduce data collection pain and enable you to focus on using analytics for your operational use cases.
In addition to open APIs and standards, there’s a rich open source ecosystem available that enables you to adopt and deploy tools for a variety of different observability use cases, including tools like Prometheus, Elastic, Jaeger, etc. We recommend that users use tools and services that are compatible with the OSS ecosystem - either through DIY implementation or compatible managed services.
Lastly, we’ve often seen that tools offered in the OSS ecosystem work well as starter tools, but can pose challenges around scaling and operations as your business grows and your services expand. In such cases, look for managed services that support open APIs and interfaces, but have proprietary implementations that address scaling and globalization challenges.
In the next section, we’ll take a look at one such service that Google offers, Google Cloud Managed Service for Prometheus.
Improve cloud operations with Google Cloud solutions
Google Cloud Managed Service for Prometheus
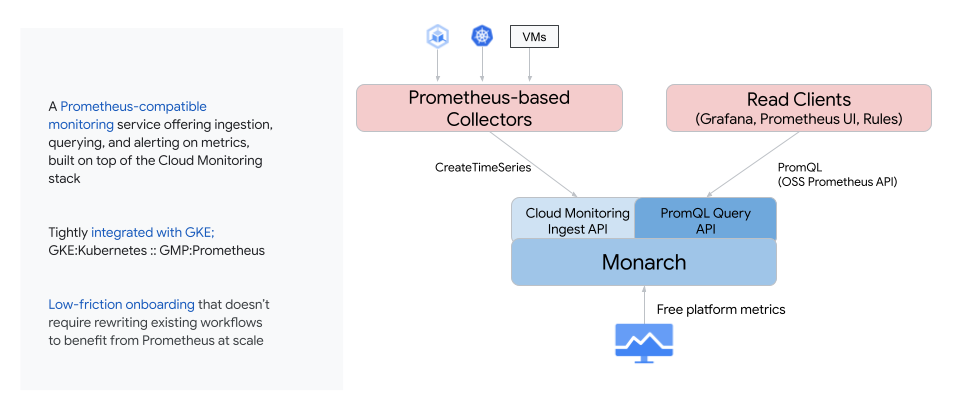
Google Cloud Managed Service for Prometheus is an example of a managed service that’s compatible with open source interfaces of Prometheus, but is delivered not just by running the OSS Prometheus, but by replacing the data store and query engine with a proprietary implementation. What does this mean exactly?
Prometheus is a popular solution, but we’ve seen that the OSS implementation has three problems:
- It’s hard to scale out, as it was primarily designed to scale up.
- It’s hard to make global, meaning if you have multiple instances of Prometheus, it’s hard to run global queries across instances.
- Once you have multiple instances, developers start spending more time managing Prometheus.
Managed Service for Prometheus offers a managed service that addresses these challenges by supporting the APIs for data collection and query using PromQL, but it stores and manages data in Google’s proprietary time series database called Monarch, which is a highly scalable monitoring service.
When users want to switch from their own instance to a managed service, they simply have to replace the OSS Prometheus upstream binary with a Google-offered Prometheus binary. This distribution scrapes the data exactly like the OSS version, but it writes data to the Google backend. Once that’s done, users can run their PromQL compatible queries against Google’s data store and everything just continues to work as it was earlier. This solution has a very low friction onboarding and all your existing dashboards and workflows continue to work.
Log Analytics
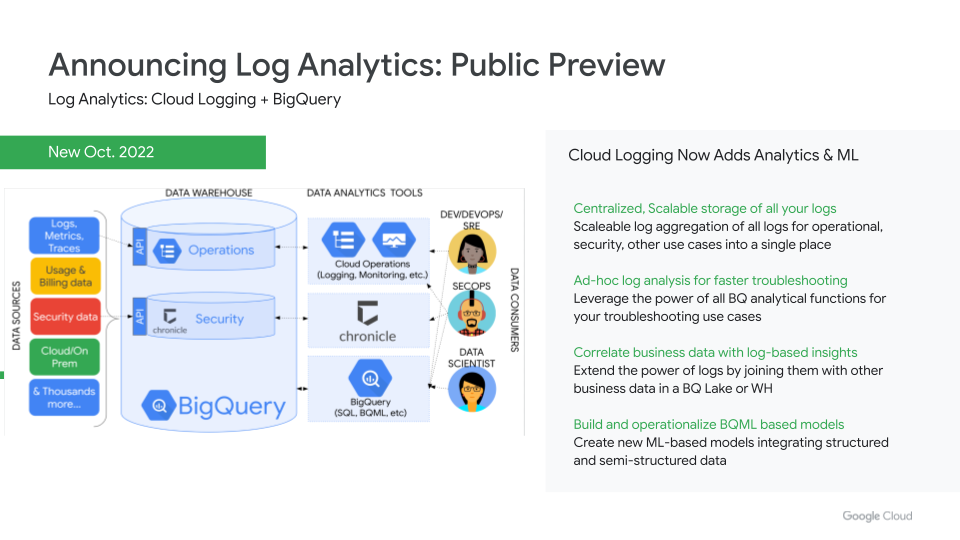
The next cloud operations solution we want to highlight is Log Analytics - now in public preview - that helps you take advantage of structured logs and all the rich context you can capture from these logs.
Previously, when you stored logs in Cloud Logging, they were stored in a proprietary store and had a query language that enabled you to search through these logs. With Log Analytics, Cloud Logging is integrated with BigQuery, making BigQuery the native store for logs.This change enables users to now tackle a variety of use cases:
- You can store all your data (i.e. business data, security data, operational log data) in one single location and scale that to petabyte levels. You don’t need to copy the log data from an operational store to another location when you want to integrate it with business data for analysis.
- You can use the power of SQL and BigQuery analytical functions for analyzing log data and faster troubleshooting. So, in addition to searching through logs, you can do aggregations, group-bys, joins, and other pivot operations on your log data to address unknown problems, which are increasingly common in distributed agile environments.
- You can join the operational log data with other business data in a BigQuery data lake or warehouse and come up with real-time business insights and how they cross-correlate with the log data.
- You can leverage the power of BigQuery ML and create ML-based models for correlation, forecasting, anomaly detection, etc.
Network Intelligence Center
As your deployment grows, so does the networking complexity, so it’s important to understand how your network behaves, especially when things break and you’re trying to fix issues with complex dependencies.
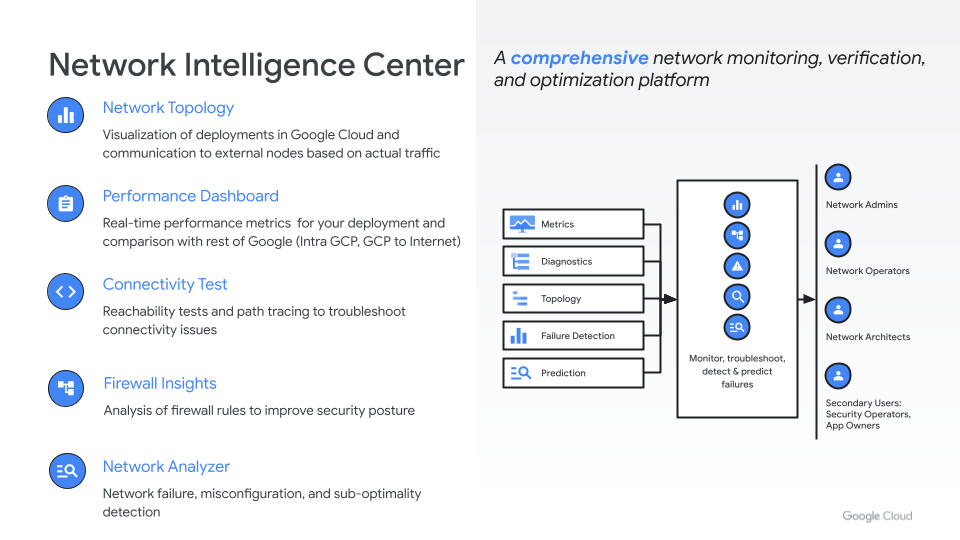
Network Intelligence Center is Google Cloud’s automated analytics and observability platform that helps deepen your ability to proactively monitor, visualize, and troubleshoot network health.
Your operations teams can now have a single place to view network deployments, understand traffic flows, quickly identify issues, and focus on improving network performance.
We’ve recently launched a few new Network Intelligence Center features to simplify networking operations even further:
- Network Analyzer (GA): Automatically monitors environments for network misconfigurations and potential failures
- Google Cloud-to-Internet monitoring (preview): View latency experienced by end users and understand where to deploy your resources for optimal performance
- “Top talkers” view in Network Topology (preview): Quickly identify and monitor largest contributors to egress, and optimize those deployments for performance or cost
Apigee API Management
When it comes to APIs, Apigee can help you minimize many operational problems and improve observability, including these key features:
- Apigee API Monitoring provides real-time insights into API performance that helps you ensure APIs are healthy and operational
- Apigee Analytics allows you to view long-term trends so you can optimize and improve the end user experience
- Anomaly Detection continually monitors API data and performs statistical analysis to distinguish true anomalies from random fluctuations in the data that helps reduce the mean time to detect API issues
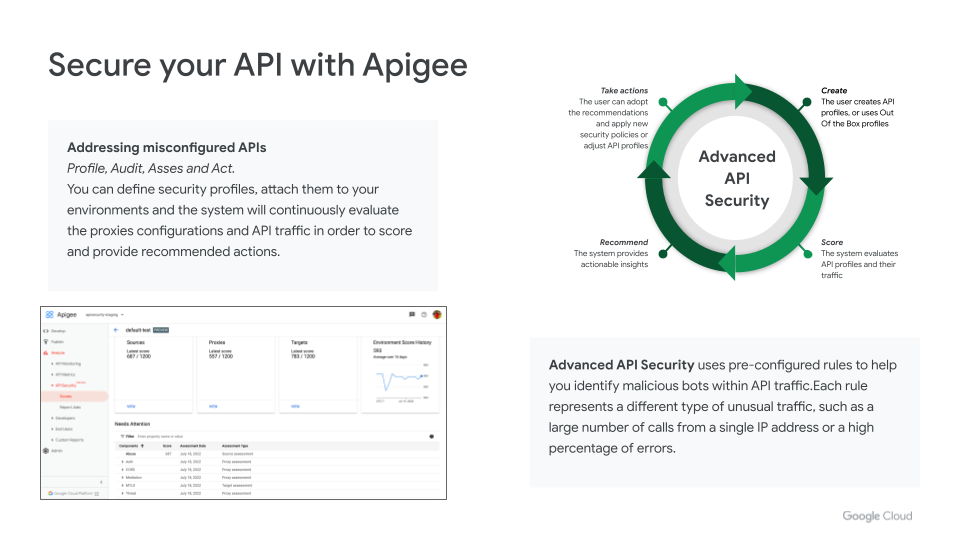
As shown in the slide below, Apigee also offers security features that help address misconfigured APIs and identify malicious bots.
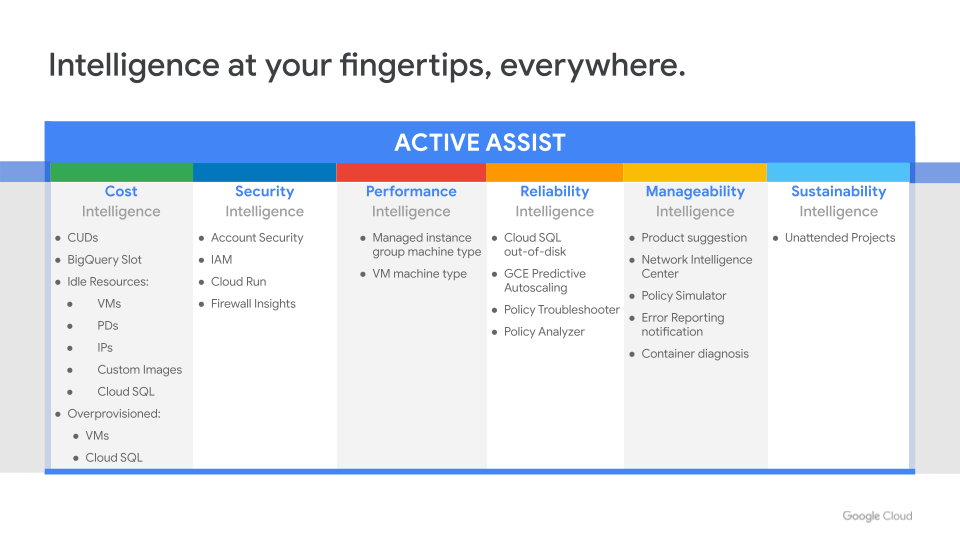
Active Assist
In this article, we covered Google Cloud’s operational tools portfolio and took a closer look into a few specific solutions and recently-released capabilities that can help you improve day 2 operations in the cloud. With all that said, we understand it can become an operational task in itself to view various tools individually and understand their insights, which is why the last solution we want to cover in this article is Active Assist.
Whether you’re interested in security, cost, networking, compute, data, or operations, Active Assist provides insights and recommendations that span across products, all in a single place.
Cloud operations Q&A
- With Cloud Monitoring, when will we be able to connect to an internal webhook (VPC has connection with on-premises via interconnect)?
For connecting to internal webhooks, you can route them through Pub/Sub. Uptime checks work against private endpoints as well. See Creating custom notifications with Cloud Monitoring and Cloud Run for more information. - When we migrate legacy applications, clients are also legacy and are not compliant to all OWASP rules. We need to permit certain runtime exceptions and block SQL injection kind of rules. These are not always known upfront and are detected Day 2 onwards. What are the ways to quickly mitigate them?
You have control over which rules are applied in your security policies. You can turn off the few rules that are blocking your legacy clients. Instructions are here. - We use hybrid setup with VPN to our on-prem data center and firewalls in between. Detecting network issues and isolating them to VPN vs firewall has become challenging. Any advice?
In a hybrid networking setup it can be challenging at times to find out the root cause of the problem if it’s a VPN/Interconnect problem vs a Firewall issue and this is where our suite of Network Intelligence Center modules could be really helpful.
Network Intelligence Center today has 5 modules, including Network Topology and Connectivity tests to help troubleshoot your connectivity issues. Find more information on Network Intelligence Center and the capabilities of each module here. - Root Reconciler goes into loop. How does one configure right resources to avoid this? how does one estimate the same ahead of time?
There are a few ways to monitor RootSync. Check out Monitor RootSync and RepoSync objects. - Any recommendations on tracing attack signatures on Cloud Armor and defining the right set of rules hierarchy, like blocking country list of banned countries?
This is the difference of subscription levels. You get basic alerts in Standard. You can get more details of the attack signature (geo, http headers, etc.) and suggested rules to mitigate the attack if you enroll in Plus subscriptions. See Google Cloud Armor pricing for more information. - Can you provide recommendations to create a multiple GCP Cloud Composer environment in a single project?
For a workflow to manage pipelines here, our partner SpringML has an interesting approach to maintain the orchestration. Check it out here. - I plan to create an aggregated sink from the whole organization and route it to 3 places at the same time:
Cloud Storage buckets - for compliance purposes
"Cloud Logging buckets" - to use "Logs Explorer"
In Splunk - to enhance information security
After reading the documentation and several attempts, I can only create 3 different sinks for each of these tasks and therefore I will have to pay for the same data 3 times even at the stage of collecting information at the “$0.50/GiB for logs ingested” tariff.
Please tell me how can I reduce the costs so as not to pay 3 times? Is it possible to make one sink and configure 3 destinations in it?
To clarify, The log ingestion price only applies to Log Buckets. If you export to other sources, the billable SKU is based on usage of the other products.
See here: “For pricing purposes, in Cloud Logging, ingestion refers to the process of writing data to the Cloud Logging API and routing it to log buckets.
You can also use log sinks to route log entries from Cloud Logging to a supported Google Cloud destination, such as a Cloud Storage bucket, a BigQuery dataset, or Pub/Sub topic. There are no Logging charges for routing logs, but the Google Cloud services that receive your logs charge you for the usage.” - To ensure the security of the entire organization, I want to collect all public IP addresses across all projects in my organization as quickly and completely as possible. At the moment, in order to collect all the whitelisted IP addresses of an organization, I have to loop through each project and request the following information:
gcloud compute instances list
gcloud compute addresses list
gcloud sql instances list
gcloud container clusters list
Then filter the server and white IP addresses by mask.
Is there a better way to do this? As far as I know, "Security Command Center" can detect "Asset" with Resource Type "Address" where there are all links to resources with public addresses. How can this be easily and quickly uploaded via the API?
Try the below query from our network specialists. You can query this information in Cloud Asset Inventory.
The address type is part of the versionedResources metadata for the compute.googleapis.com/Address resource.  Unfortunately, it's not currently possible to search versionedResources directly in Cloud Asset Inventory.  You can, however, do one of the following:

- Export Cloud Asset Inventory to BigQuery and write your own queries.

- If you have a Linux shell and jq installed, you can stitch together the following to get a CSV-formatted list of all external IP addresses in the organization:

gcloud asset search-all-resources \
 --scope=organizations/{org-id} \
 --asset-types='compute.googleapis.com/Address' \
--read-mask='*' \
--format=json \
| jq -r '.[] | select(.versionedResources[].resource.addressType=="EXTERNAL") | [.displayName, .versionedResources[].resource.address, .parentFullResourceName] | @csv' - Is there documentation of yaml and runtime.go deployment files best known practices for successful day 2 operations [PaaS, Cloud Run, GKE, etc]?
Check this out.
Have additional questions? Please leave a comment below and someone from the Community or Google Cloud team will be happy to help.

 Twitter